Real Estate
How to Track Real Estate Asset Performance: Metrics, Methods, and Systems
By Mayank Pokharna (Coliving Expert)
• 9 min read
Mar 19, 2026
Share
Key Takeaways
- Asset performance tracking provides the evidence base for every hold, improve, refinance, and dispose decision an asset manager makes.
- The most important metrics combine income performance, cost efficiency, occupancy, and capital value movement into a complete picture of each asset.
- Net operating income is the single most important income metric for most asset types because it reflects operational performance before financing decisions.
- Valuation movements must be tracked consistently over time using a defined methodology to be meaningful as a performance indicator.
- Benchmarking individual asset performance against portfolio averages and market comparables adds context that absolute figures alone cannot provide.
- A well-designed performance tracking system is always current, not assembled manually at quarter end.
An asset manager who cannot quickly answer the question “how is this asset performing?” is not in a position to manage it effectively. And yet, in many property businesses, answering that question requires pulling data from several systems, reconciling discrepancies, and producing a calculation that may take half a day to arrive at. Performance tracking should not be a periodic exercise. It should be a continuous capability: the ability to see, at any moment, how each asset in the portfolio is performing against its targets and against comparable assets. This article covers what to measure, how to measure it reliably, and how to build the system that makes it accessible.
Why Asset Performance Tracking Matters
Asset performance tracking is the foundation of every significant decision in asset management. Decisions about capital expenditure, lease strategy, refinancing timing, and asset disposal all need to be grounded in accurate, current performance data. Without it, decisions are based on intuition or on data that is several months old by the time it is used. The cost of a wrong decision at the asset level, compounded over a holding period, can be significant. The cost of not knowing when to dispose of an underperforming asset, or of investing capital into one that is not generating the return to justify it, is real even when it is not explicitly calculated. Performance tracking also provides the accountability framework for the asset management function itself. Targets are set, performance is measured against them, and the gap between target and actual informs both asset-level decisions and the assessment of how well the asset management function is performing.
The Key Metrics for Asset-Level Performance
A complete picture of asset performance requires metrics across four dimensions: income, cost, occupancy, and capital value. No single metric tells the full story. An asset with strong income but rising costs and declining occupancy is heading in a different direction from an asset with strong income, controlled costs, and full occupancy. An asset with a high current yield but deteriorating capital value may be harvesting return at the expense of long-term portfolio value. The metrics need to be read together.
Income Metrics: What to Monitor and Why
Gross rental income (GRI) is the total rent contracted across all current leases for the asset. It reflects the asset’s income-generating capacity at full occupancy based on current contracted rents. Net rental income deducts void costs, rent-free periods, and incentives from GRI to reflect the income actually being received. The gap between GRI and net rental income is a measure of the asset’s occupancy efficiency. Net operating income (NOI) deducts all operating costs from net rental income. It is the most widely used measure of an asset’s operational financial performance because it reflects what the asset earns after the cost of running it but before financing. NOI is the basis for yield calculations and valuation capitalisation. Passing yield expresses NOI as a percentage of the asset’s current market value. It is the income return the asset is currently generating and is comparable across assets of different sizes. Reversionary yield expresses the asset’s estimated rental value (ERV) as a percentage of its current market value. It indicates whether the asset is currently over-rented (passing yield above reversionary) or under-rented (passing yield below reversionary) relative to current market levels.
Expenditure and Cost Metrics
Total operating expenditure by category tracks the full cost of running the asset: maintenance, management fees, insurance, service charge contributions, and compliance costs. Tracking this against budget and against prior period identifies where cost pressure is building. Maintenance cost per unit or per square metre normalises the maintenance spend for assets of different sizes, enabling meaningful comparison across the portfolio and against external benchmarks. Cost ratio expresses total operating expenditure as a percentage of gross rental income. A rising cost ratio indicates that the asset is becoming less efficient to operate, which may reflect deferred maintenance creating higher reactive costs, management inefficiency, or the impact of age on the building’s systems. Capital expenditure against plan tracks actual capex against the approved capital plan for the asset. Significant variance from plan in either direction, large unplanned expenditure or significant underspend relative to plan, is a signal that requires understanding.
Valuation and Capital Performance
Current valuation is the market value of the asset as assessed by an independent valuer at the most recent valuation date. For most portfolios, formal valuations are produced quarterly or annually. Between formal valuations, the asset manager maintains an estimated current value based on market evidence and any significant events that would affect value. Capital value movement tracks the change in asset value over time, both in absolute terms and as a percentage of the opening value. Combining capital value movement with NOI gives the total return for the period: the complete measure of how the asset has performed for its owners. Net asset value (NAV) contribution measures each asset’s contribution to the portfolio’s total NAV: its current value less any debt secured against it. This is the metric that matters most to equity investors who own the residual value after debt is repaid. Loan-to-value (LTV) tracks the ratio of debt to asset value. Rising LTV may indicate a combination of declining asset value and stable debt, which has implications for covenant compliance and refinancing options.
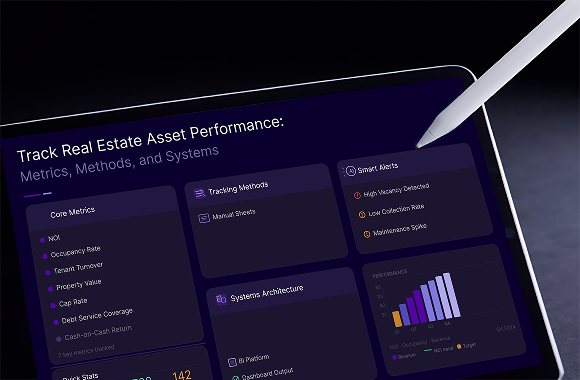
Building a Performance Tracking System
The most common performance tracking approach in property businesses is a combination of spreadsheets updated manually at quarter end. This approach has a predictable set of problems: data that is always historical, figures that differ between the spreadsheet and the operational systems, and a process that consumes significant finance team time to produce. A well-built performance tracking system draws from the operational data sources that generate the underlying numbers, consolidates them in a central analytics environment, and surfaces the performance metrics in a dashboard that is always current. The operational sources include: the property management system for income and occupancy data, the finance system for expenditure and NOI, the debt management records for LTV and covenant data, and the valuation records for capital value. Integrating these sources and mapping them to the correct metrics requires careful data architecture work. The result is a performance tracking capability that is current at all times, consistent across the portfolio, and requires no manual assembly for each reporting period. Our Real Estate Asset Management Software page covers how we build asset performance tracking into custom platforms for property investors and managers.
Conclusion
Asset performance tracking is not a reporting exercise. It is the operational infrastructure that makes asset management decisions reliable rather than approximate. When the data is fragmented across disconnected systems and assembled manually each quarter, the decisions made between reporting periods are made without a complete picture. Capital is allocated, leases are negotiated, and disposal decisions are deferred based on information that is already historical. The gap between what the data shows and what is actually happening in the portfolio widens with every week that passes between updates. A performance tracking system that is current, consistent, and connected to the operational sources that generate the underlying numbers changes that fundamentally. The asset manager can see, at any point, how each asset is performing across income, cost, occupancy, and capital value. The decisions that follow are better informed, faster to make, and easier to defend to investors and lenders. Building that system requires investment in data architecture and integration that most property businesses have not yet made. For those that have, it is consistently cited as one of the highest-return investments in the asset management function.
FAQ
When in doubt always ask?
The most important metrics span four dimensions: income (gross rental income, net operating income, passing yield, reversionary yield), cost (total operating expenditure, maintenance cost per unit, cost ratio), occupancy (occupancy rate, average void duration, days-to-let), and capital value (current valuation, capital value movement, total return, LTV).
Net operating income is gross rental income minus all operating costs, excluding financing costs. It is the standard measure of an asset’s operational financial performance and the basis for yield and valuation calculations.
Passing yield is the current NOI expressed as a percentage of the asset’s current market value. Reversionary yield is the estimated rental value (ERV) expressed as the same denominator. The relationship between the two indicates whether the asset is currently over- or under-rented relative to current market levels.
Operational metrics such as arrears and occupancy should be reviewed monthly or more frequently. Financial performance including NOI and cost ratio is typically reviewed monthly. Capital performance including valuation and total return is reviewed quarterly or when a significant market or asset event occurs.
Total return is the sum of income return (NOI as a percentage of asset value) and capital growth (change in asset value as a percentage of opening value) over a defined period. It is the most complete measure of how an asset has performed for its owners.